NWCSAF - GEO
NWCSAF is one of a number of satellite application facilities (SAFs) operated by EUMETSAT. In the case of NWCSAF the focus is the provision of tools to aid in the production of nowcasting products from geostationary satellite imagery. NWCSAF-GEO is the software produced as part of the NWCSAF. The NWCSAF-GEO software take High Rate Information Transmission (HRIT) files downloaded via a satellite dish (the SWIFT dish is located at the Chilbolton observatory) as well as numerical weather prediction data (we use Global Forecast System; GFS data). A large number of products can be produced using NWCSAF-GEO. These products allow forecasters and researchers to easily glean information from satellite radiance and reflectance data. They are produced by product generation elements (PGEs) within the NWCSAF-GEO task manager. The different PGEs and the products that are included are detailed below.
GEO-CMA Cloud Mask
Identifies cloudy/cloud-free pixels to be used as a prerequisite for the running of other PGEs, it is also a product in its own right. Also includes non-standard CMA products such as CMA-dust, which indicates cloudy pixels cloud free pixels and regions where mineral dust has been raised.

Cloud mask dust

GEO-CT Cloud Type
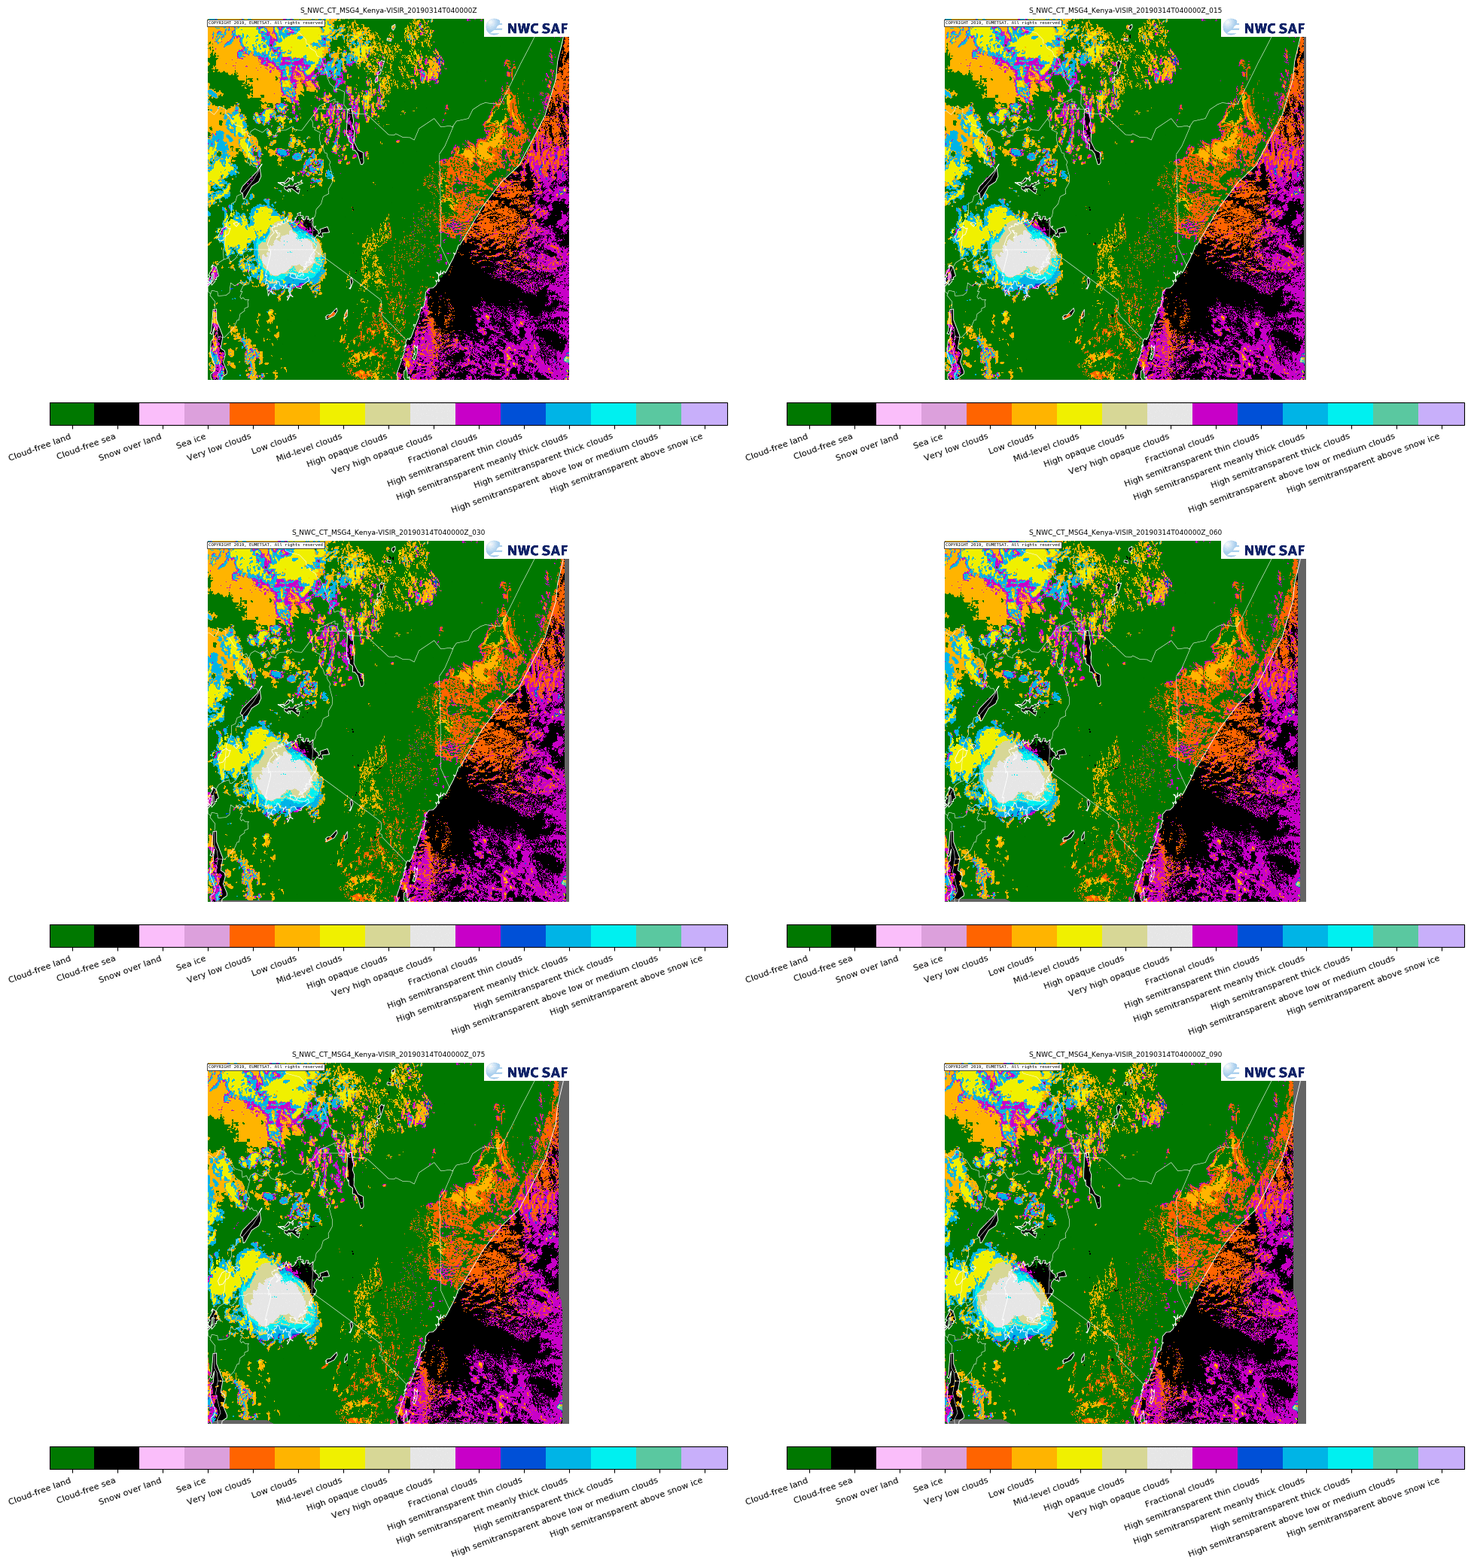
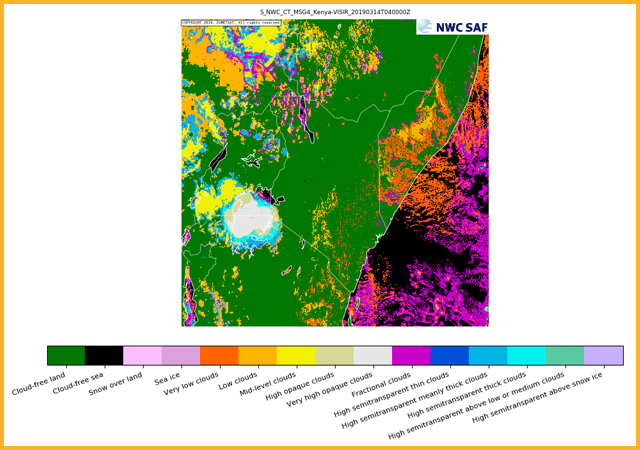
All cloudy pixels identified by the cloud mask PGE are categorized into one of 11 cloud types (see image) that describe the height, thickness and opacity. Cloud free pixels are categorized into land, sea, snow or sea-ice.GEO-CTTH Cloud Top Temperature and Height
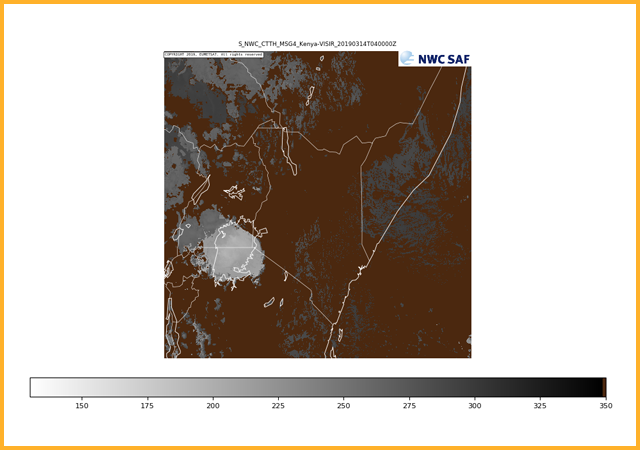
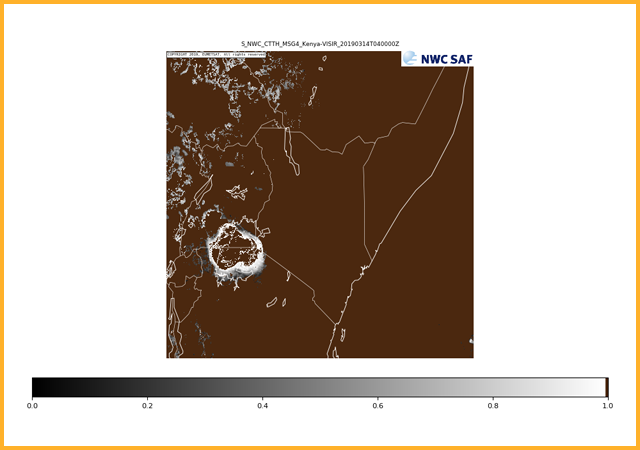
Calculates the cloud top properties of cloudy pixels identified by GEO-CMA. Products generated are the cloud top pressure (Pa), cloud top altitude (m), cloud top temperature (K) and the effective cloudiness (represents the fractional cloudiness).
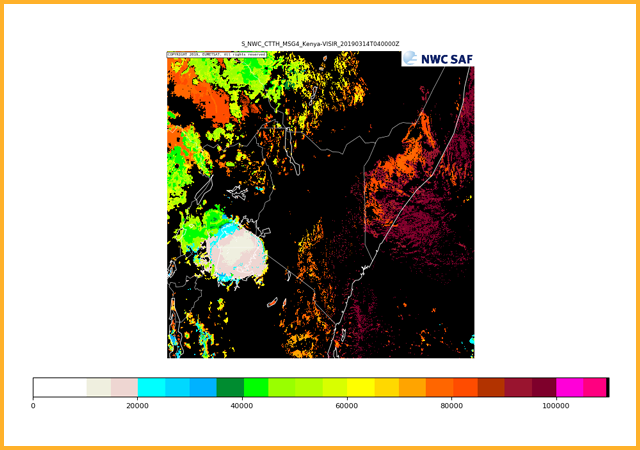 Cloud top altitude
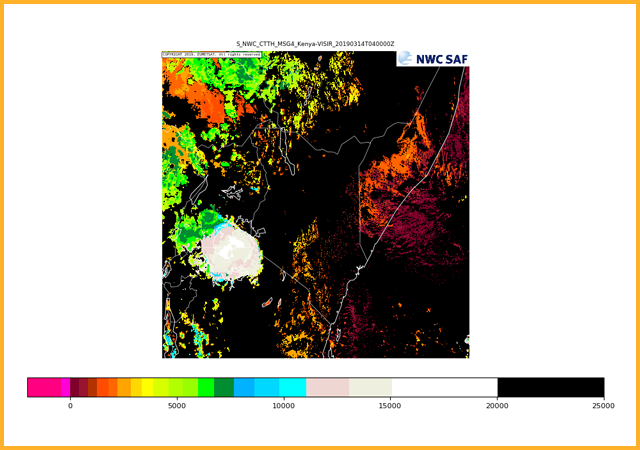 Cloud top temperature
 Cloud top effective cloudiness
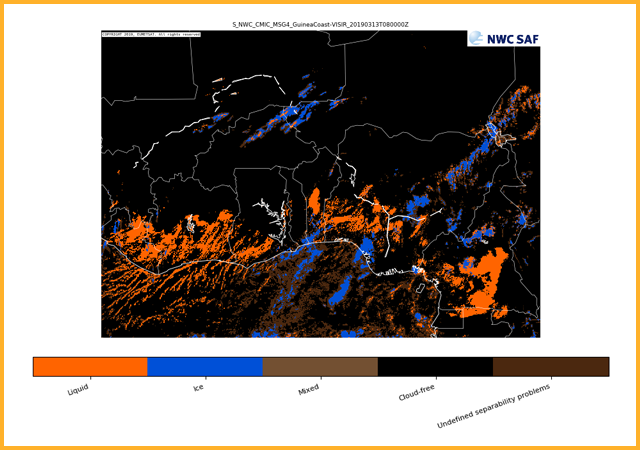
Cloud top water phase
Cloud top droplet effective radius
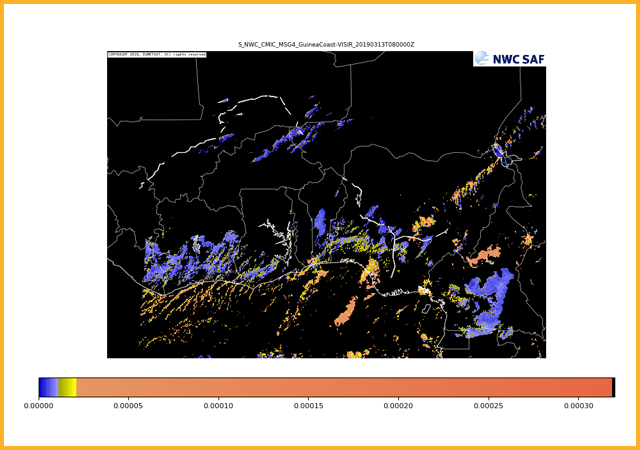
Cloud optical thickness
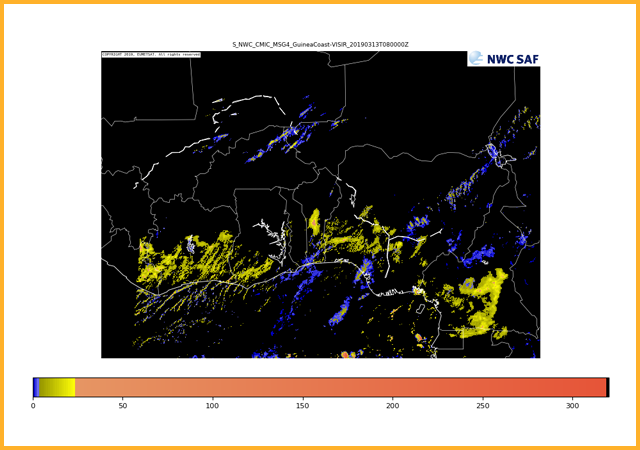
Cloud liquid water path
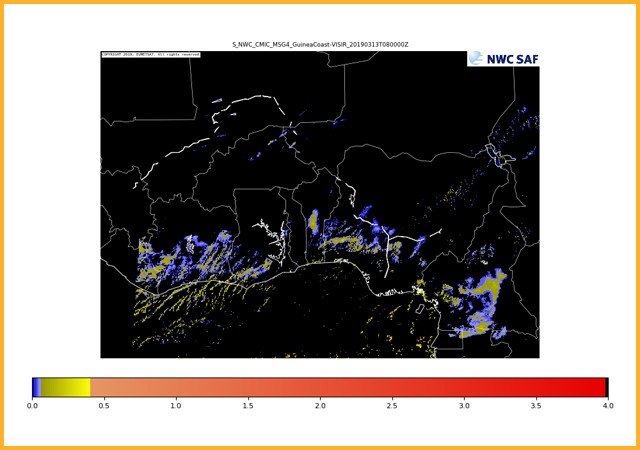
Cloud ice water path
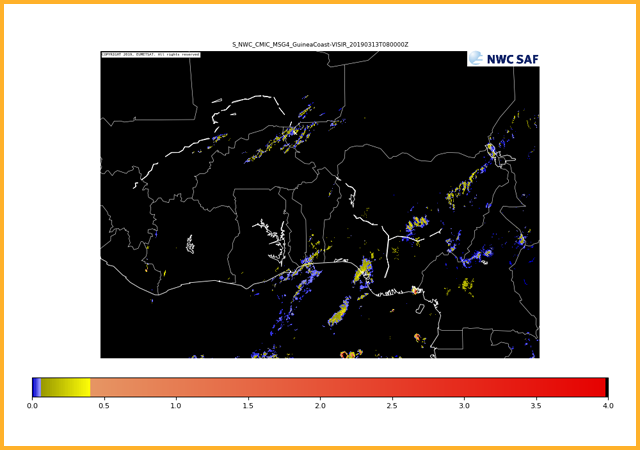
GEO-CMIC Cloud MICrophysics
Provides information on cloud microphysical properties of cloudy pixels. Products generated are cloud top phase (indicating whether cloud tops are liquid water, ice or mixed phase), cloud top effective radius, cloud optical thickness, cloud liquid water path and cloud ice path.GEO-PC Precipitating Clouds
Estimates the chance of cloudy pixels precipitating (at a rate greater than 0.2 mm/hr). The likelihood of rainfall is given as a percentage and is split into increments of 10%.
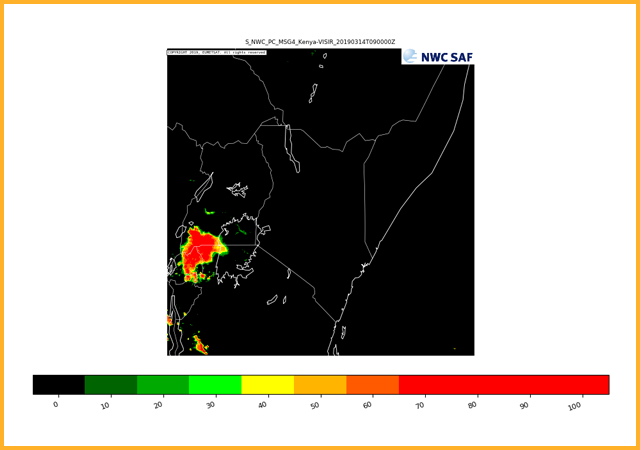
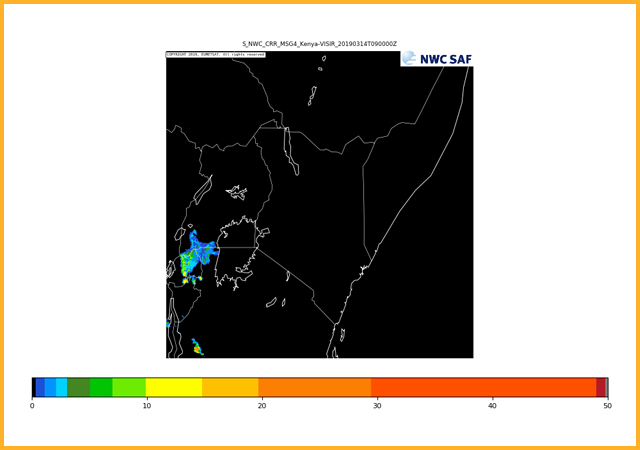
GEO-CRR Convective Rainfall Rate
Estimates the convective rainfall rate based on infrared, water vapour and visual channels. Deep, optically thick clouds are most likely to produce rainfall. The algorithms used are obtained by the analysis of simultaneous MSG and rainfall radar data. Rainfall deemed to be stratiform is removed from the product and only convective rainfall is shown. It should be noted that due to the geographical limitations of where rainfall radar is present the algorithm is likely optimised for higher latitudes than are the focus of SWIFT, therefore, additional care should be taken in using this product.GEO-PC-Ph Precipitating Clouds - from cloud Physical properties
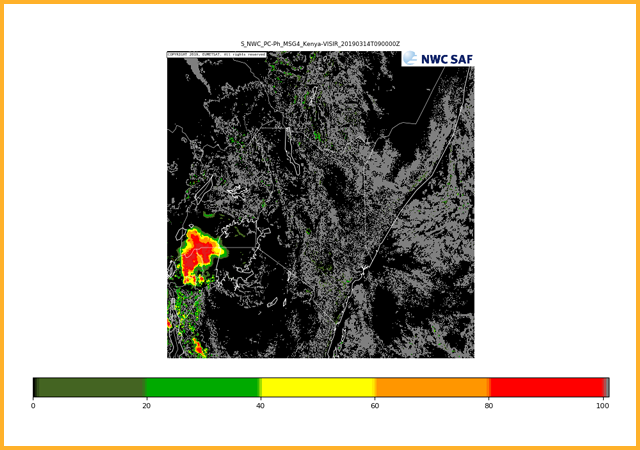
Estimates the chance of cloudy pixels precipitating (at a rate greater than 0.2 mm/hr). The likelihood of rainfall is given as a percentage and is split into increments of 20%. The results of the cloud top microphysical properties (GEO-CMIC) are used to give additional information compared to the standard precipitating clouds product (GEO-CMIC).
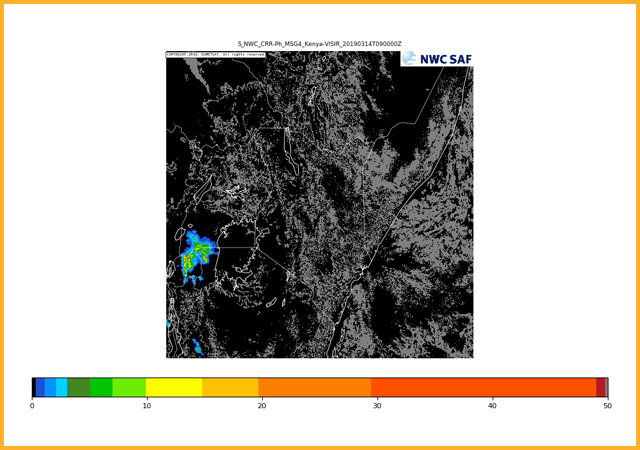
GEO-CRR-Ph Convective Rainfall Rate - from cloud Physical properties
Estimates the convective rainfall rate based on cloud microphysics product ( GEO-CMIC) and a computation of the cloud water path, lightning data can also be ingested. Deep, optically thick clouds are most likely to produce rainfall. This product is dependent on solar channels and as such is only available during daytime hours.GEO-RDT-CW Rapidly Developing Thunderstorm - Convection Warning
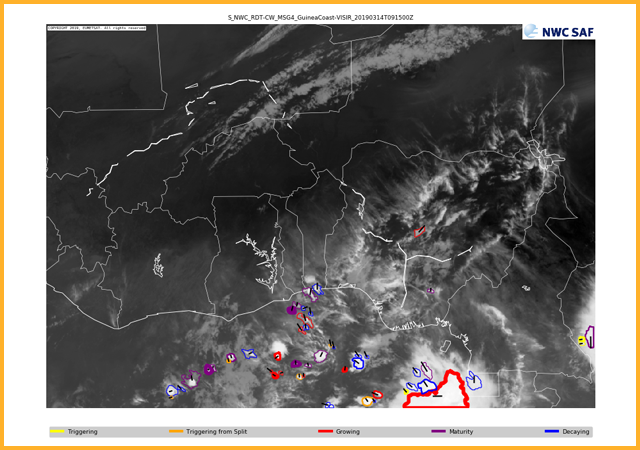
Identifies convective cells and indicates the direction of travel for the next hour. Utilises the IR10.8 channel brightness temperature with a variable threshold to give 1 cloud tower per cell (threshold and min cloud top temp need to differ by at least 6°C). Convective cells are discriminated from non-convective cells by comparing spatial and temporal characteristics, a mixture of statistical and empirical rules and NWP derived stability indices. Cells are characterised by their strength (thickness of line surrounding the cell) and whether they are triggering (yellow), triggering from a split (orange), growing (red), mature (purple) or decaying (blue).
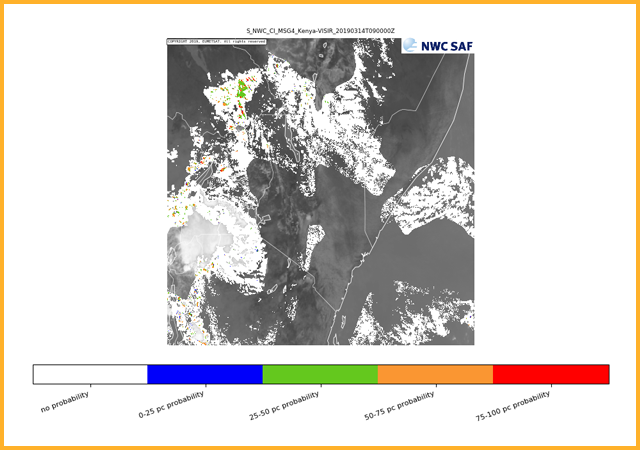
GEO-CI Convective Initiation
Aiming to provide a forecast of the likelihood of convective initiation from the latest observation time. In particular the chance that a cloudy pixel will become a thunderstorm within the next 30, 60 or 90 mins (Only 30 min generated for the SWIFT catalogue). The first signs of convection occur after the formation of clouds and can be a predictor of coming convection.GEO-iSHAI imaging Satellite Humidity And Instability product
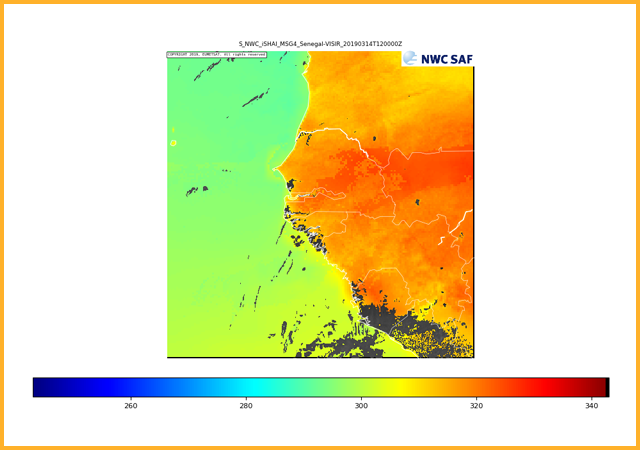
This product generates the clear air outputs for the NWCSAF GEO software. For cloud-free pixels a wide number of products are generated (only a few have been selected for routine generation as part of SWIFT, those included in the catalogue are in bold). The available products are: (1) Total Precipitable Water (2) Precipitable water in low layer (surface to 850 hPa) (3) Precipitable water in middle layer (850 hPa to 500 hPa) (4) Precipitable water in high layer (500 hPa to top of atmosphere) (5) Lifted Index (6) Showalter Index (7) K-Index (8) Skin Temperature (shown here) (9) Total Ozone (10) BT_Residual (11-19) difference fields between calculated values for products (1-9) and the values derived solely from the provided NWP data
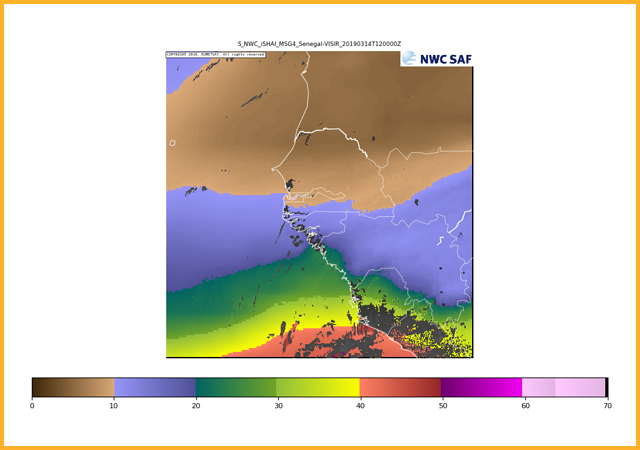 Low level precipitable water (surface to 850 hpa)
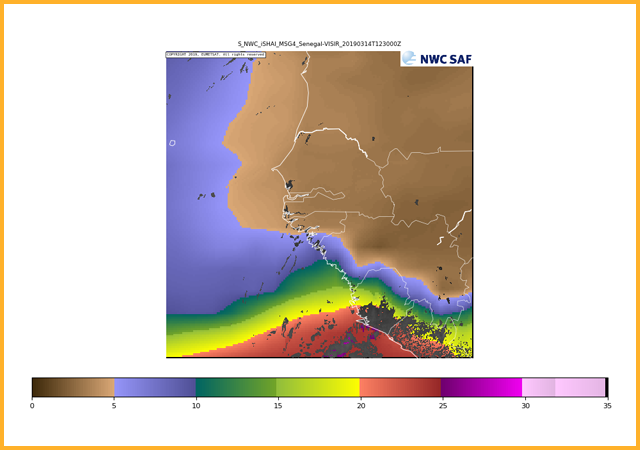 Middle level precipitable water (850 hPa to 500 hpa)
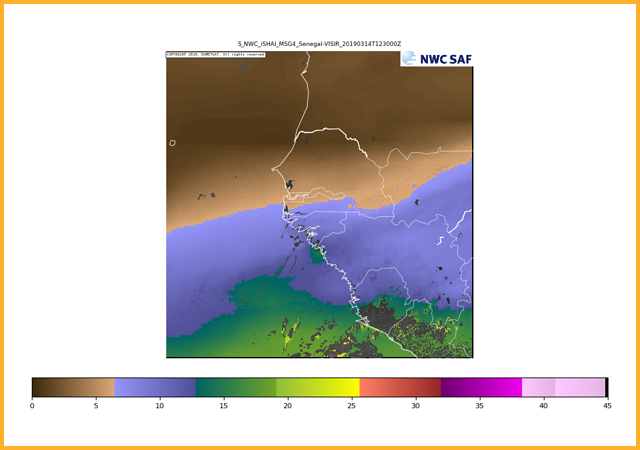 High level precipitable water (500 hPa to top of atmosphere)
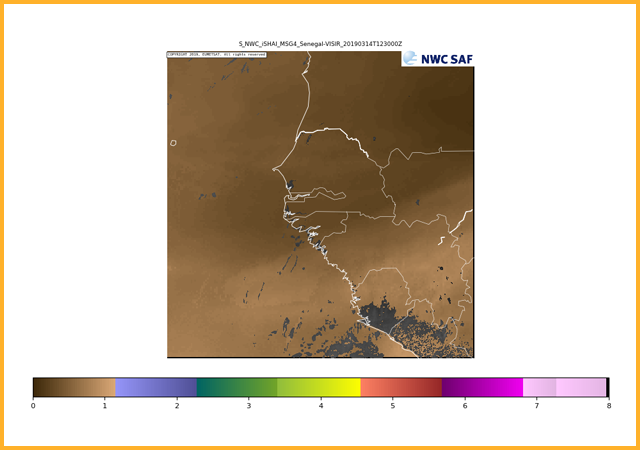 Lifted index
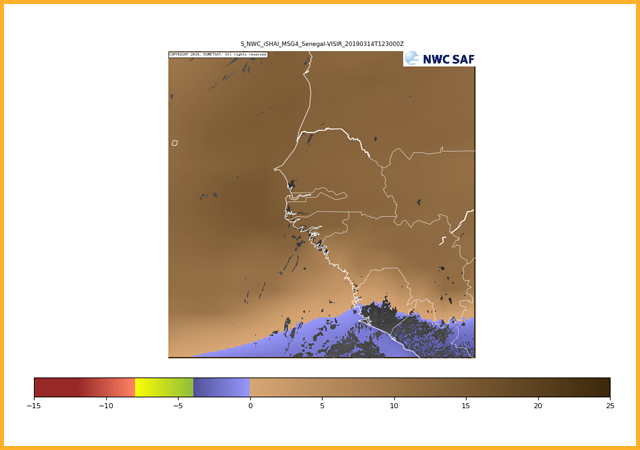 Showalter index
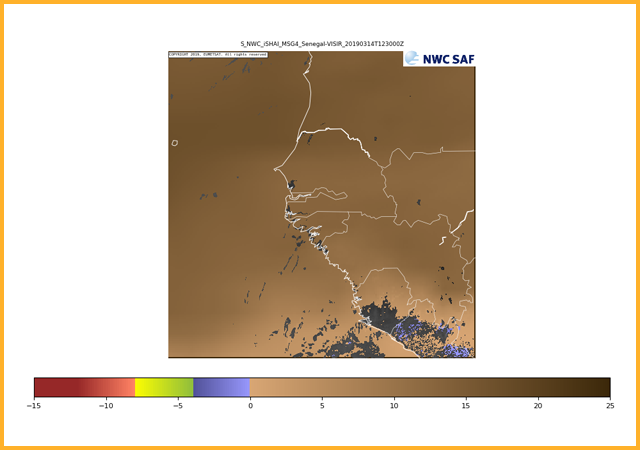 K-index
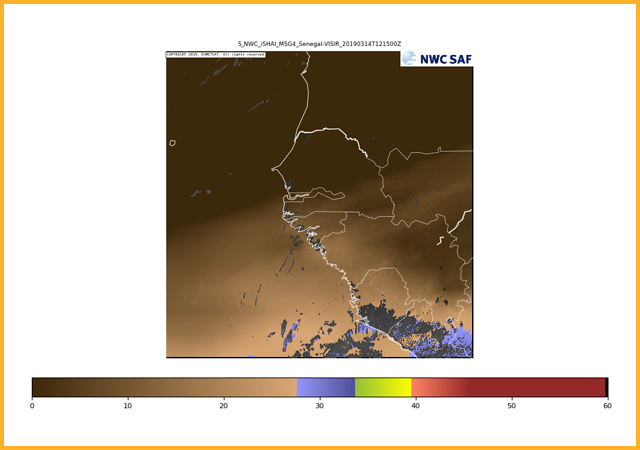 Skin temperature
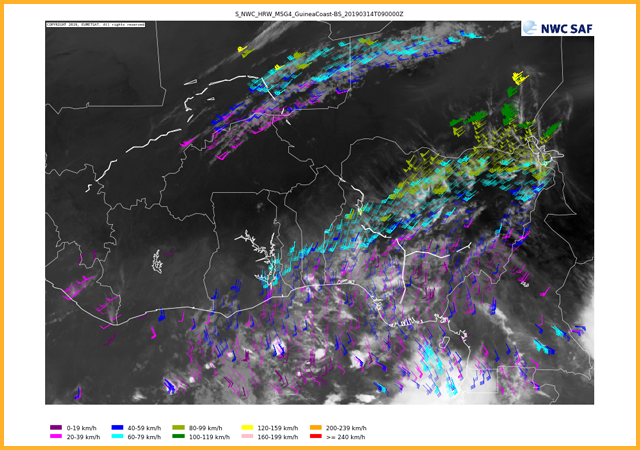
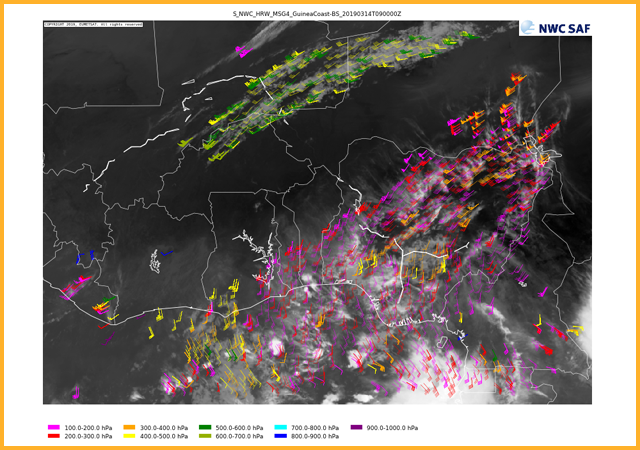 Wind barbs sorted by wind speed
 1 hour wind trajectories sorted by pressure level
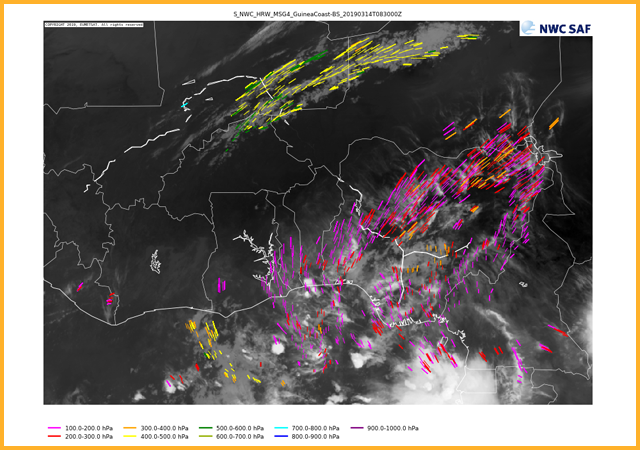
GEO-HRW High Resolution Winds
This product provides information on satellite image derived winds and trajectories using a variety of visible and infrared channels. The atmospheric motion vectors and trajectories are determined through the tracking of cloud features from one image to the next. NWP data is also used to augment motion vectors determined from cloud movements. Winds can be separated both by their pressure level (as shown here) or by their speed. Individual pressure pressure ranges are also plotted individually and are available in the catalogue.GEO-ASII Automatic Satellite Image Interpretation
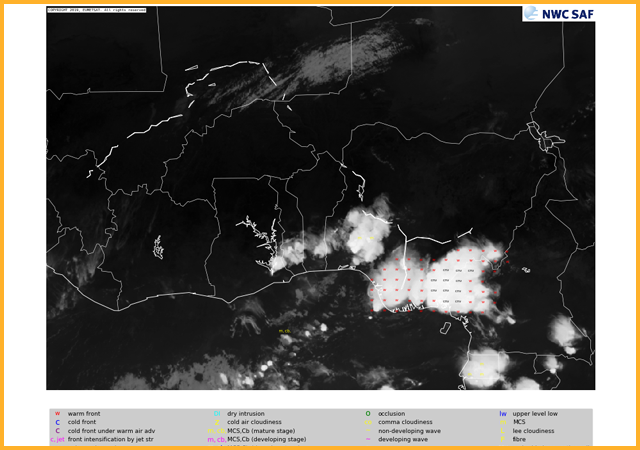
Aims to automatically identify the weather type based on the satellite images. While on european data this automatic categorization of clouds is very successful (likely due to the frontal structure of clouds at more northerly latitudes) there is a tendency over Africa for large convective storms to be categorized as something other than convective storms. As such this product should be used with care.
GEO-ASII-NG Automatic Satellite Image Interpretation - Next Generation
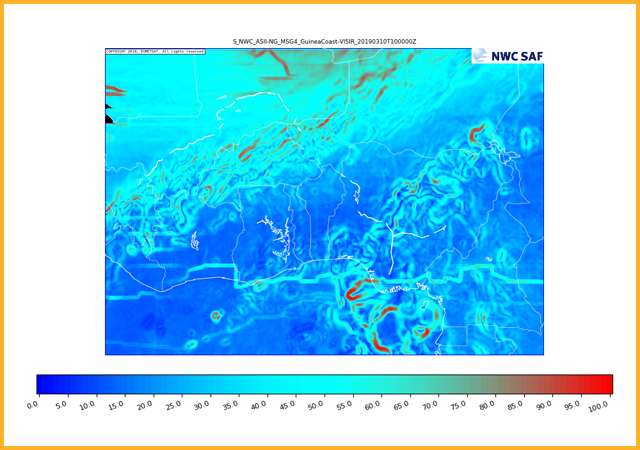
The next generation ASII product aims to give useful information on clear air turbulence (important for meteorologists and aviation). The ASII-NG PGE produces a probability of tropopause folding map. Tropospause folds indicate regions where stratospheric air descends and intrudes into the troposphere. Stratospheric intrusions have high potential vorticity, low moisture and can be responsible for strong shear. Over Africa it should be noted that often the strongest signals for this products are associated with the edge of the upper outflow region of convective storms. While this might represent a turbulence risk it is not the intended purpose of the product.GEO-EXIM EXtrapolated IMagery products
Some of the NWCSAF-GEO products can be extrapolated forward in time through the use of cloud motion vectors (when insufficient clouds are present forward extrapolation cannot be performed). The products that this is possible for are; GEO-CMA cloud mask, GEO-CT cloud type, GEO CTTH cloud top temperature and height, GEO-CMIC cloud microphysics, GEO-PC precipitating clouds, GEO-CRR convective rainfall rate, GEO-PC-Ph precipitating clouds - physical retrieval, GEO-CRR-Ph convective rainfall rate - physical retrieval.
