Website Overview
- Home Page
The image on the home page is the latest available surface rainfall rate. The status below the image will say if the radar is operating normally, stowed for strong winds, or not working due to system failure. In these cases the image will not be current and will be “greyed out”.
- Quicklooks Page
The Quicklooks page shows a calendar of dates and lists the categories (images) available for each date:
- Surface Rainfall Rate - an estimate of the amount of rainfall at the ground in millimetres per hour
- 1° and 2° PPIs - low elevation circular scans
- RHI - a cross-section scan
More information about the categories is given in the Background Information section.
Click on one of the categories and it will show you a series of variables available for that type of scan. At present there is only one variable for PPIs and RHIs, called Reflectivity.
Click on the variable and it takes you to a thumbnail page. You can either click on a single image and then step through one by one, or alternatively click on ANIM at the top right, which will load an animation of all available scans for the day you have chosen. It can take some time for the animation to load.
You also have the option to download the images as a ZIP or TAR file.
- Latest Radar Images
This page shows the latest set of images available. There is a short time delay (10-15mins) between the radar producing the images and their upload to the website. If the images are “greyed out”, it usually means the radar has been stowed and is not collecting any data.
- Real-time Site Weather
NCAS has deployed a Davis Vantage Vue weather station on the radar platform to provide real-time information on the conditions at the site. This allows NCAS to monitor the weather, particularly to inform decisions of whether to stow the radar for strong winds.
The Met Office also operates a weather station in the same location. Hourly observations from the site can be viewed here: https://www.metoffice.gov.uk/public/weather/observation/gctqjsxwu
Background Information
- Scanning Pattern
The radar performs two main types of scans: PPI = Plan Position Indicator and RHI = Range Height Indicator. A PPI is a revolution around 360° of azimuth but at a constant elevation angle (https://www.youtube.com/watch?v=Yrq2TVdM8HI). An RHI is a cross-section where the radar points at the same azimuth angle and only changes in elevation.
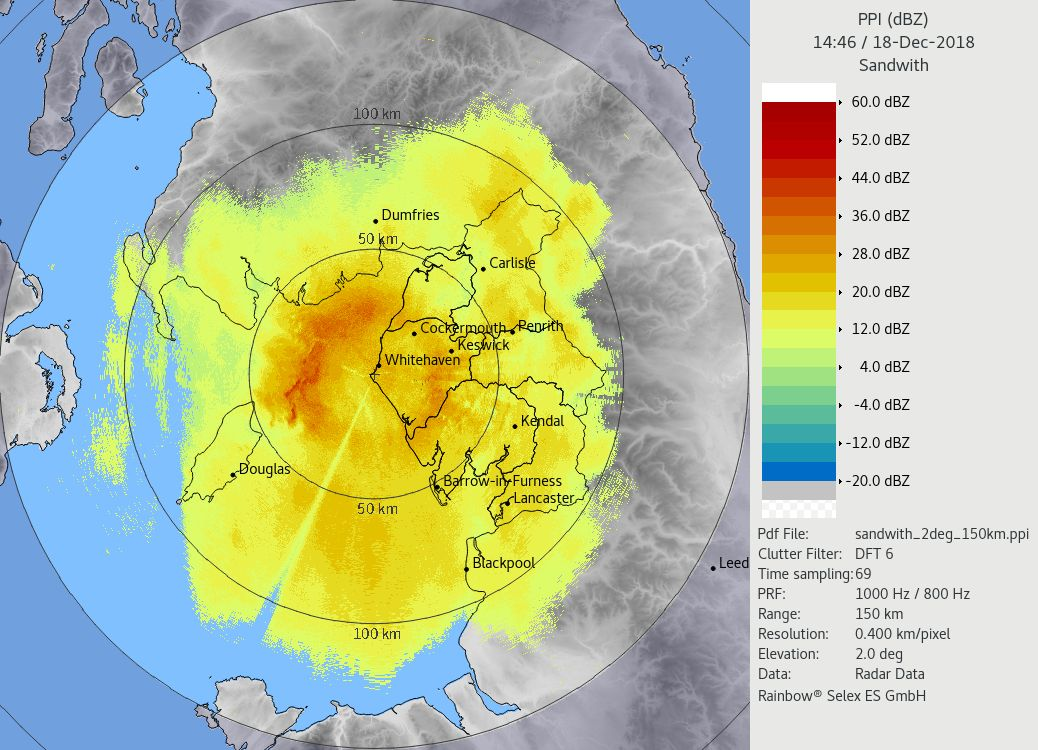
A 2° PPI scan, with the radar located in the centre and data measured out to 150 km range. There is a notable spike of lower reflectivity to the south west. This is a blockage caused by the telecoms mast at the site. 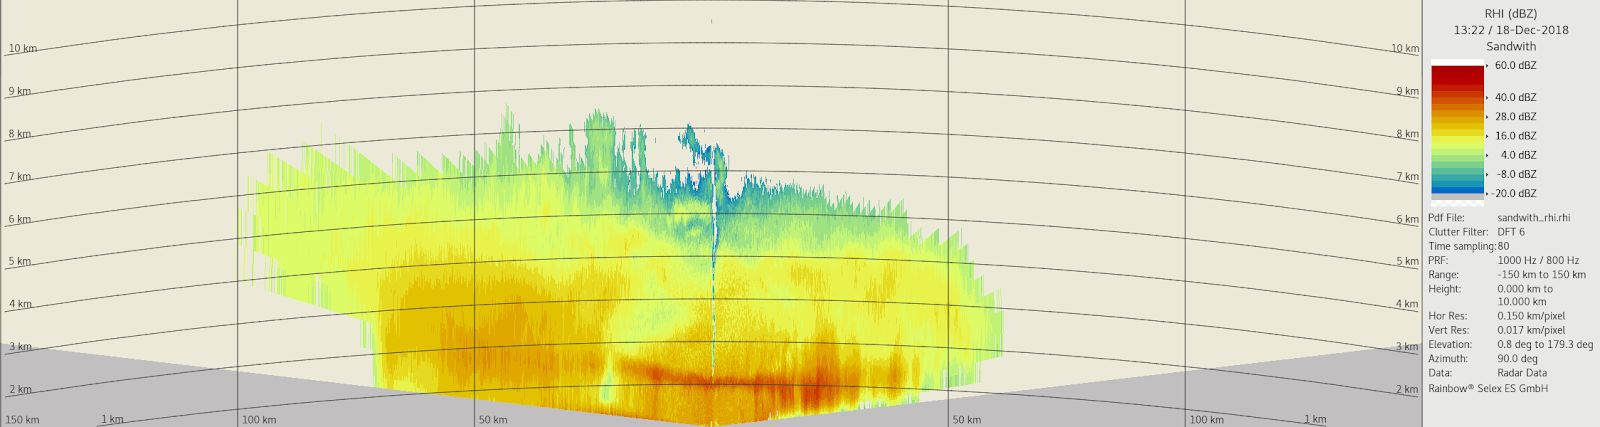
An RHI scan. The radar starts at 90° azimuth (to the right on the plot) and 0.5° elevation, and scans slowly upwards to 90° elevation (vertical), then down in the opposite direction, at 270° azimuth (to the left on the plot). This provides a cross-section through the atmosphere. The analogy is like taking a slice of a cake and looking at its layers. It provides us with more detailed information on the vertical structure of clouds and precipitation. The radar performs a sequence, or volume, of scans approximately every 5 minutes. It does PPI scans at 0.5, 1, 1.5, 2, 3, 4.5, 6, 7.5, 10° and 20°, a calibration scan at 90° and finally an RHI from 90° to 270°.
The catalogue displays the 1° and 2° PPIs and the RHI. Additionally we are creating a rainfall rate image, which uses data from the lower elevation PPIs.
- Radar Principles
The radar transmits pulses of microwaves, some of which are reflected back to the radar by precipitation. The radar measures the intensity of the reflected signal, the reflectivity, which is a function of the number (N) and size (D) of the precipitation particles. It is given the symbol Z and is actually a function of diameter to the 6th power i.e. Z~ND6 with units of mm6/m3. Due to this large dependence on D, Z can vary by many orders of magnitude so we convert it to a log scale with units of dBZ (decibels of Z). 30 dBZ is an order of magnitude greater than 20 dBZ, in the same way that an earthquake of magnitude 6 on the Richter Scale is 10 times greater than one of magnitude 5.
Rainfall rate (in mm/hr) is a function of the number, volume and fall speed of the particles (R~ND3v). So there is a relationship between reflectivity and rainfall, but we have to make assumptions about the number and size of the precipitation particles we are measuring.
To illustrate this principle, let’s say we collected 100ml of rainfall over an hour in two different locations, e.g. a tropical versus a continental environment, and also measured the number and sizes of the drops. We would see a very different distribution of particles in the two locations. Although we collected the same volume of rain, if a radar had observed this rainfall, the type with the much larger size particles would have produced a much higher reflectivity, due to the dependence of Z on D6. We can get the same rainfall rate from different types of rain.

To convert from Reflectivity to Rainfall Rate, we use the equation Z = aRb where a and b are adjustable parameters. The standard formula is the Marshall-Palmer relationship, Z = 200R1.6, and is typically representative of mid-latitude stratiform rainfall. Many other relationships exist that better represent the distribution of drop sizes in different types of events or environments e.g. convective rain.
- Considerations for Rainfall Rate
The height of the radar beam above ground increases with increasing range, as illustrated below. At 50km range, the centre of the 0.5° elevation beam will be ~0.5km above ground and the 2° elevation beam will be nearly 2km above ground.
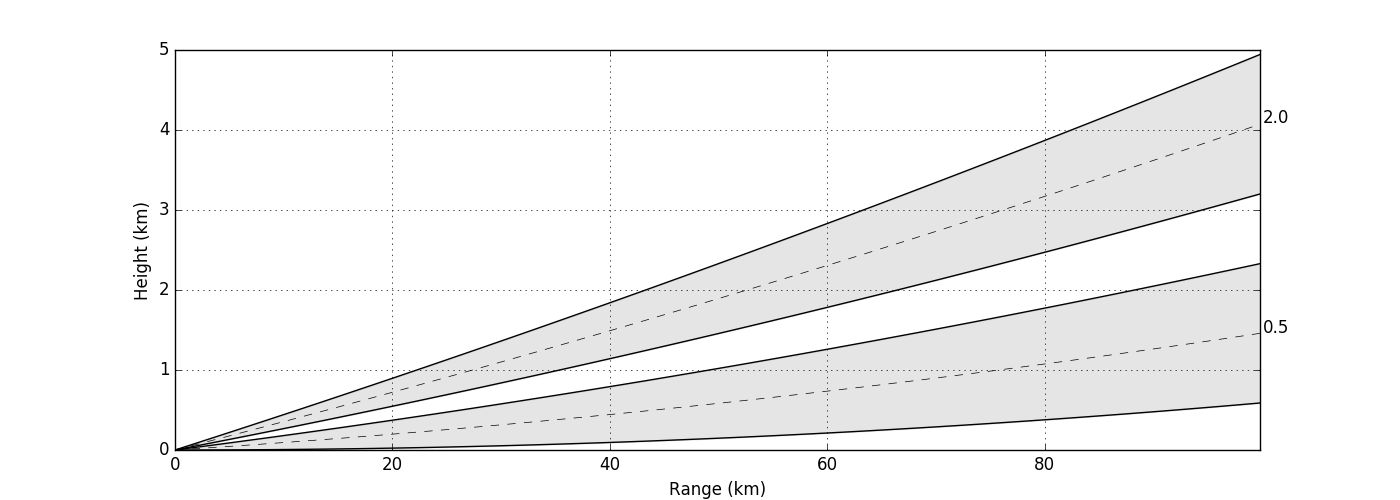
This is an important consideration, especially in winter, as it means that the higher elevation beams are likely measuring above the freezing level (where the atmospheric temperature drops to 0°C) and observing ice and snow, rather than rain.
Additionally, hills and mountains create blockages, lower elevation angles will be blocked and we need to look higher up to “see” over and beyond them.
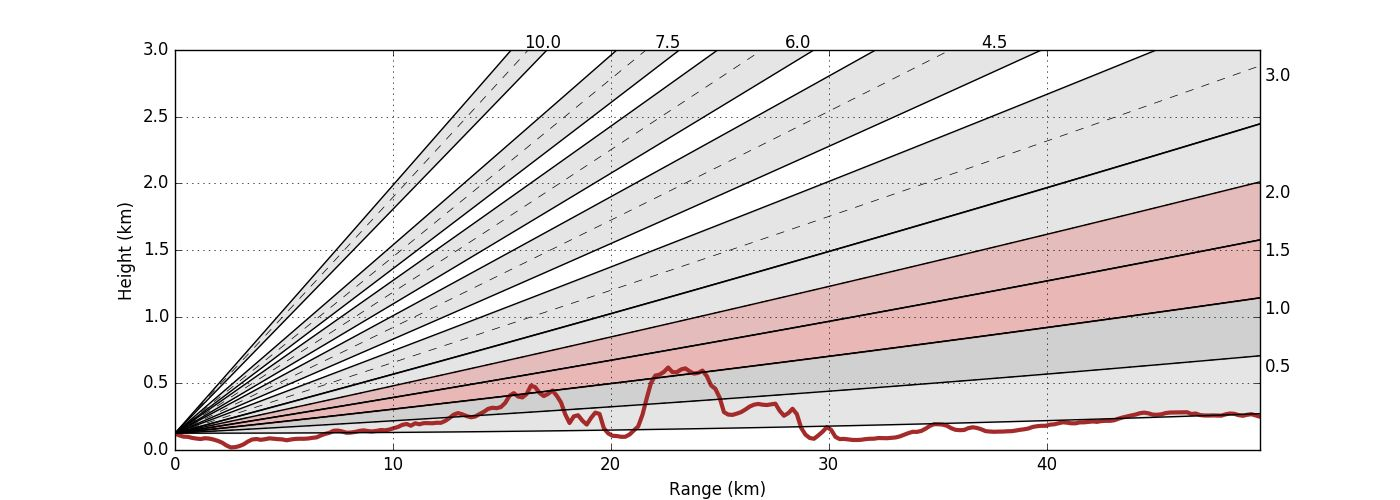
A cross-section of the profile of the land elevation (red line) at an azimuth of 73°, out to 50km range. The purpose is to illustrate where data is taken from in order to calculate a surface rainfall rate. The y-axis shows altitude, and the numbers on the right hand side and top indicate the different elevation scans of the radar. The beamwidth is 1°, which means some of the lower elevation beams overlap (darker shading). The hills between 10 and 25km range cause the lowest 2 elevations (0.5° and 1°) to be blocked. To retrieve a rainfall measurement beyond the hills at 30-50km range we have to use the 1.5° beam, whose data comes from 1-1.5km altitude. For higher hills and longer ranges, we have to use higher elevation beams (data from higher altitudes). In summary: surface rainfall is not always derived from radar data that is actually close to the surface and hence may not be as accurate. We calculate a best estimate with the data that is available. We can improve the rainfall estimates through additional post-processing and over time will be implementing additional processing in the software in real-time.
- Signals from non-precipitating targets
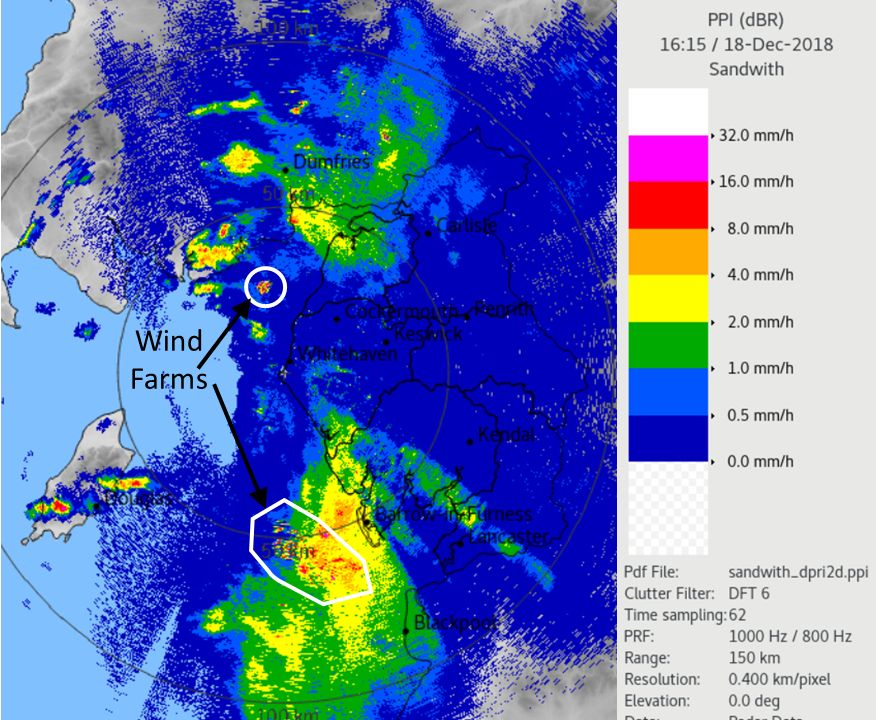
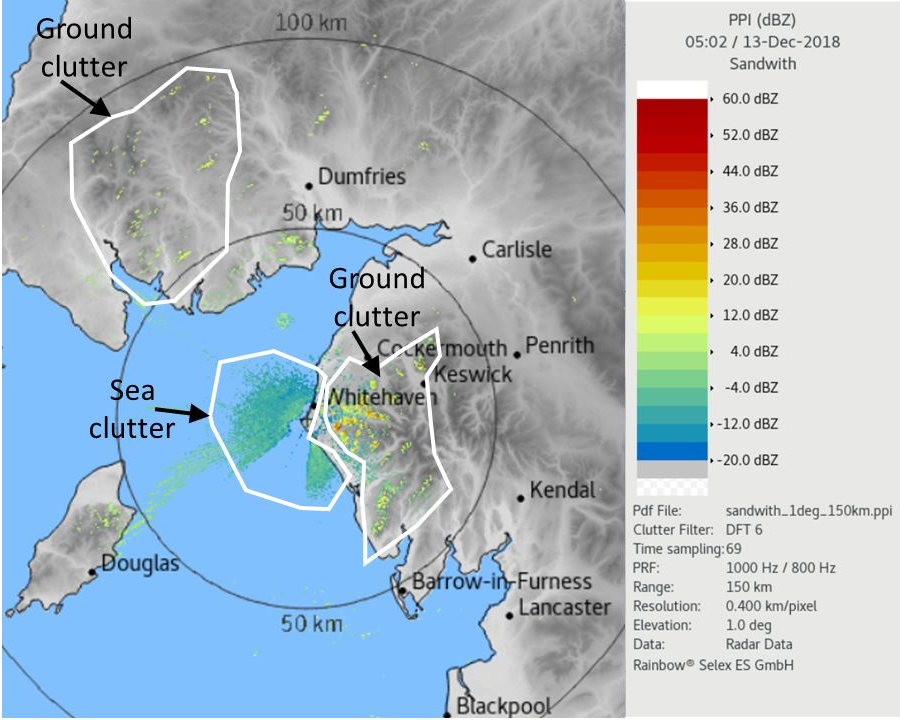
Although the data goes through quality control and processing within the software itself, there are some artefacts and echoes from non-precipitating targets that have not been successfully removed. Sometimes the signals from these features will mimic intense rainfall, but can usually be differentiated by playing an animation and observing how the signals do not move with time. These echoes are usually ground clutter including hills and wind turbines, sea clutter and noise. Due to the proximity to the coast we see large areas of sea clutter, although mostly at the lowest elevation angle of 0.5°. The Robin Rigg and Walney wind farms are often clearly visible in the Solway Firth and Irish Sea. See examples below.